Day 2: Lines
This map was created as part of a study where we were looking at the location and content of outdoor advertisements.We were particularly interested in whether vulnerable populations in deprived areas had greater exposure to fast food, gambling and alcohol advertisements. To address this problem we develop a deep learning workflow to automatically extract and classify unhealthy advertisements from street-level images that we collected using a 360 degree camera. We found evidence of social inequalities with a larger proportion of food advertisements located within deprived areas and those frequented by students.
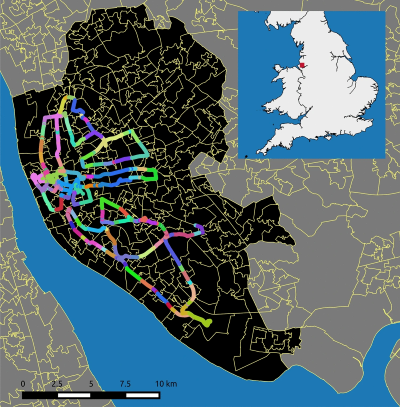
The map depicts the path we took collecting datawith the colour coded segments indicating lower-layer super output areas (LSOAs) boundaries.

Full details can be found in this paper:
Palmer, G., Green, M., Boyland, E., Vasconcelos, Y. S. R., Savani, R., & Singleton, A. (2021). A deep learning approach to identify unhealthy advertisements in street view images. Scientific Reports, 11(1). https://doi.org/10.1038/s41598-021-84572-4