Day 25: Heat
In this paper, we examined gas consumption trends in the residential sector across England and Wales from 2010 to 2020. It highlighted how the UK’s heavy reliance on natural gas, combined with inefficient housing stock, poses challenges to achieving net-zero carbon emissions by 2050.
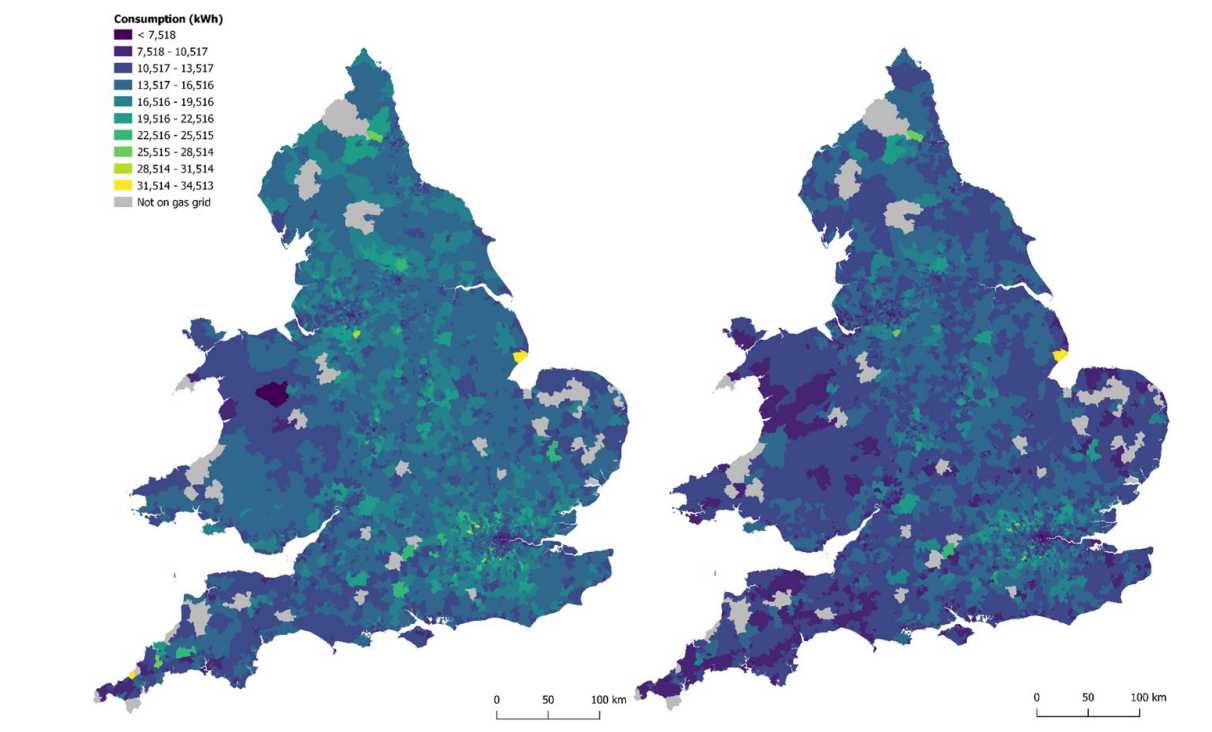
The spatial distribution of median gas consumption is mapped at the Middle Super Output Area (MSOA) level for the years 2010 (left panel) and 2020 (right panel) and highlights a noticeable reduction in gas consumption over the decade. Urban areas, particularly in cities like London, show lower gas consumption levels compared to rural areas. This disparity is likely due to the smaller average property sizes and better insulation in urban dwellings. Conversely, rural areas with larger properties and less efficient insulation exhibit higher consumption levels. The gas consumption data is available for each MSOA here.

Full details can be found in this paper:
Ward, C., Robinson, C., Singleton, A., & Rowe, F. (2024). Spatial-Temporal Dynamics of Gas Consumption in England and Wales: Assessing the Residential Sector Using Sequence Analysis. Applied Spatial Analysis and Policy, 17(3), 1273–1300. https://doi.org/10.1007/s12061-024-09584-9